

Soil classification and behavior prediction form the foundation of geotechnical engineering practice. Among the most fundamental laboratory tests used to characterize fine-grained soils, Atterberg limits provide essential data that engineers rely on to assess plasticity, consistency, and potential performance under load. These empirical indices, developed over a century ago, remain integral to site investigations, foundation design, and construction materials testing. Understanding how moisture content influences clay and silt behavior enables engineering professionals to make informed decisions about earthwork suitability, slope stability, and bearing capacity. For consulting firms managing complex civil infrastructure projects, accurate determination and interpretation of these limits supports defensible recommendations and risk mitigation strategies throughout project lifecycles.
Understanding Soil Plasticity and Consistency States
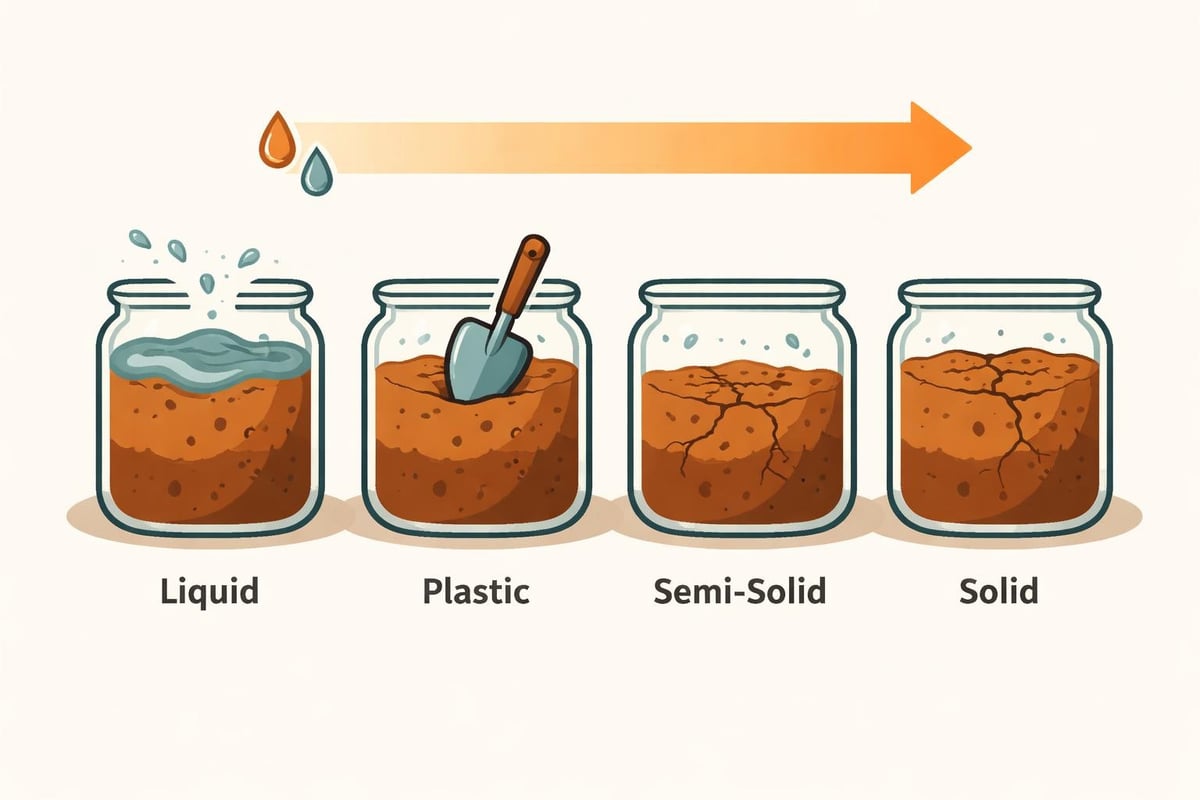
Plasticity describes a soil's ability to undergo deformation without cracking or changing volume. Fine-grained soils containing clay minerals exhibit plastic behavior across a range of moisture contents, transitioning between distinct consistency states as water content increases or decreases. These transitions occur at specific moisture thresholds that define the boundaries between solid, semi-solid, plastic, and liquid states.
The concept of Atterberg limits emerged from Swedish agricultural scientist Albert Atterberg's early 20th-century research into soil behavior. He identified critical moisture contents where soil consistency changes fundamentally, establishing standardized test procedures that remain relevant today. Modern geotechnical practice recognizes three primary limits: the liquid limit, plastic limit, and shrinkage limit, each representing a transition point in soil behavior.
Liquid Limit Definition and Significance
The liquid limit represents the moisture content at which soil transitions from plastic to liquid behavior. At this threshold, the soil barely maintains shear strength and flows under slight disturbance. Engineers determine this value using either the Casagrande cup method or the fall cone penetrometer, both providing standardized measurements of the moisture content where soil behavior fundamentally shifts.
Key characteristics of soils at the liquid limit include:
- Minimal shear strength (approximately 2 kPa)
- Flow behavior under standard impact conditions
- Groove closure after 25 blows in the Casagrande apparatus
- Transition from moldable to flowable consistency
Plastic Limit and Plasticity Characteristics
The plastic limit defines the moisture content where soil transitions from plastic to semi-solid state. Below this threshold, the soil becomes too dry to exhibit plastic deformation and begins to crumble when rolled into threads. The standard test procedure involves rolling soil into 3.2 mm diameter threads repeatedly until the sample can no longer maintain cohesion at this dimension.
This value establishes the lower boundary of the plastic range, within which soils can be molded and deformed without breaking or becoming fluid. Construction activities such as compaction, grading, and earthwork manipulation become significantly more difficult when moisture content falls below the plastic limit. Advanced geotechnical laboratory testing capabilities enable precise determination of these critical thresholds.
Shrinkage Limit and Volume Change Behavior
The shrinkage limit represents the moisture content below which further drying produces no additional volume reduction. This parameter proves particularly valuable when assessing soils prone to desiccation cracking, foundation heave, or settlement associated with seasonal moisture fluctuations. Soils with low shrinkage limits exhibit greater volume change potential, creating challenges for structures built on expansive clay foundations.
| Consistency State | Moisture Range | Soil Behavior | Engineering Implications |
|---|---|---|---|
| Liquid | Above liquid limit | Flows, no shear strength | Unsuitable for construction |
| Plastic | Between plastic and liquid limits | Moldable, cohesive | Workable for earthwork |
| Semi-solid | Between shrinkage and plastic limits | Stiff, brittle | Limited workability |
| Solid | Below shrinkage limit | Hard, volume stable | Maximum strength |
Plasticity Index and Soil Classification
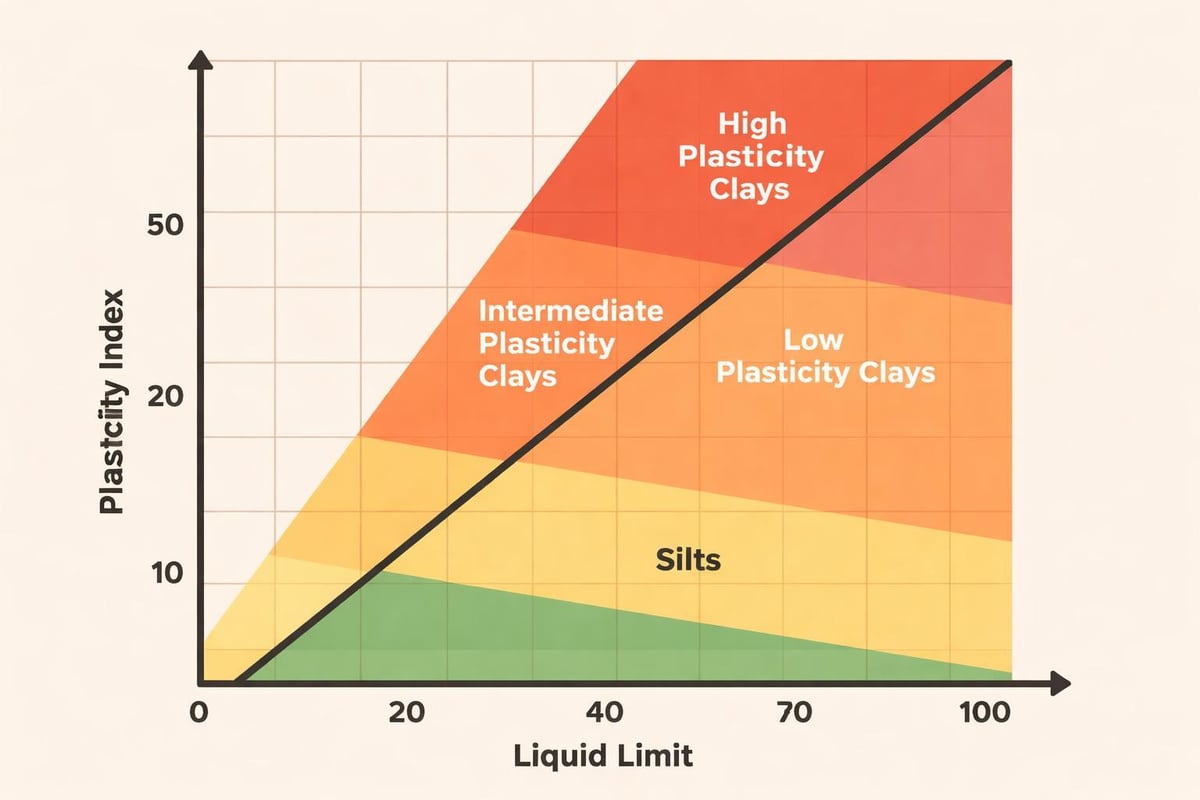
The plasticity index, calculated as the numerical difference between liquid limit and plastic limit, quantifies the range of moisture content over which soil exhibits plastic behavior. Higher plasticity index values indicate greater clay content and more pronounced plastic characteristics. This single parameter provides immediate insight into soil type, compressibility, and engineering behavior.
Geotechnical engineers use the plasticity index in conjunction with other classification parameters to categorize soils according to the Unified Soil Classification System (USCS) or AASHTO classification schemes. Fine-grained soils with plasticity indices below 7 typically classify as silts or low-plasticity clays, while values exceeding 17 indicate high-plasticity clays with significant clay mineral content.
Research examining how soil structure and clay mineralogy influence these measurements demonstrates that mineralogical composition directly affects plasticity characteristics. Montmorillonite clays exhibit substantially higher plasticity indices than kaolinite or illite clays due to differences in particle structure and water absorption capacity.
Liquidity Index and Consistency Assessment
The liquidity index relates a soil's natural moisture content to its Atterberg limits, providing a normalized measure of current consistency. Values near zero indicate moisture content close to the plastic limit, while values approaching one suggest moisture content near the liquid limit. Negative values occur when natural moisture content falls below the plastic limit, indicating stiff or hard consistency.
Formula: Liquidity Index = (Natural Moisture Content – Plastic Limit) / (Liquid Limit – Plastic Limit)
This dimensionless parameter enables direct comparison of soil consistency across different soil types and sites. Field observations correlate well with liquidity index values, supporting rapid assessment of excavation characteristics, trafficability, and compaction suitability during site investigations.
Activity Index and Clay Behavior
The activity index, defined as the ratio of plasticity index to clay-size fraction (particles smaller than 2 microns), characterizes clay mineral reactivity. Soils with activity values exceeding 1.25 contain active clay minerals prone to significant swelling and shrinkage, while values below 0.75 indicate relatively inactive clays with minimal volume change potential.
Engineers evaluating sites for foundation structures or slope stability applications rely on activity indices to predict long-term performance and identify potential issues related to expansive soils or seasonal moisture variations.
Laboratory Testing Procedures and Standards
Standardized testing protocols ensure consistency and reproducibility when determining Atterberg limits. Both ASTM International and the American Association of State Highway and Transportation Officials (AASHTO) maintain detailed specifications governing test equipment, sample preparation, and calculation methods. These standards enable comparison of results across laboratories and projects while supporting quality assurance objectives.
Sample Preparation Requirements
Proper sample preparation significantly influences test accuracy and reliability. Technicians air-dry field samples, remove particles larger than the No. 40 sieve (0.425 mm opening), and thoroughly mix the remaining material to achieve homogeneity. For liquid limit testing, soil passes through the No. 40 sieve, while plastic limit testing uses material passing the No. 40 sieve with particles coarser than the No. 200 sieve (0.075 mm) removed in some cases.
The moisture conditioning phase requires careful attention to achieve uniform water distribution throughout the sample. Technicians add distilled or deionized water incrementally, mixing thoroughly and allowing equilibration periods to ensure consistent moisture content. Testing typically occurs at multiple moisture contents spanning the expected limit values, enabling accurate determination through graphical or mathematical interpolation.
Liquid Limit Testing Methods
Casagrande Cup Method (ASTM D4318):
- Place prepared soil in the brass cup to a depth of 10 mm
- Cut a groove using the standard grooving tool
- Rotate the crank at 2 revolutions per second
- Record the number of blows required for groove closure over 13 mm length
- Repeat at different moisture contents to establish the flow curve
- Determine liquid limit at 25 blows through interpolation
The fall cone method, widely adopted internationally and increasingly common in North America, offers advantages in operator consistency and reduced subjectivity. A standardized cone with specific mass and geometry penetrates the soil surface, with penetration depth correlating to moisture content and shear strength.
Plastic Limit Determination
The plastic limit test involves manually rolling soil into 3.2 mm diameter threads on a non-absorbent surface. Testing procedures outlined by standardized methods require operators to roll threads until they begin to crumble at the prescribed diameter, indicating moisture content at the plastic limit. Multiple determinations ensure representative values, with results typically reported as the average of acceptable trials.
Experienced technicians develop tactile sensitivity that improves test consistency, though operator variability remains a recognized limitation. Modern laboratories supplement manual testing with automated or semi-automated equipment that reduces subjectivity while maintaining correlation with traditional methods.
Engineering Applications and Design Implications
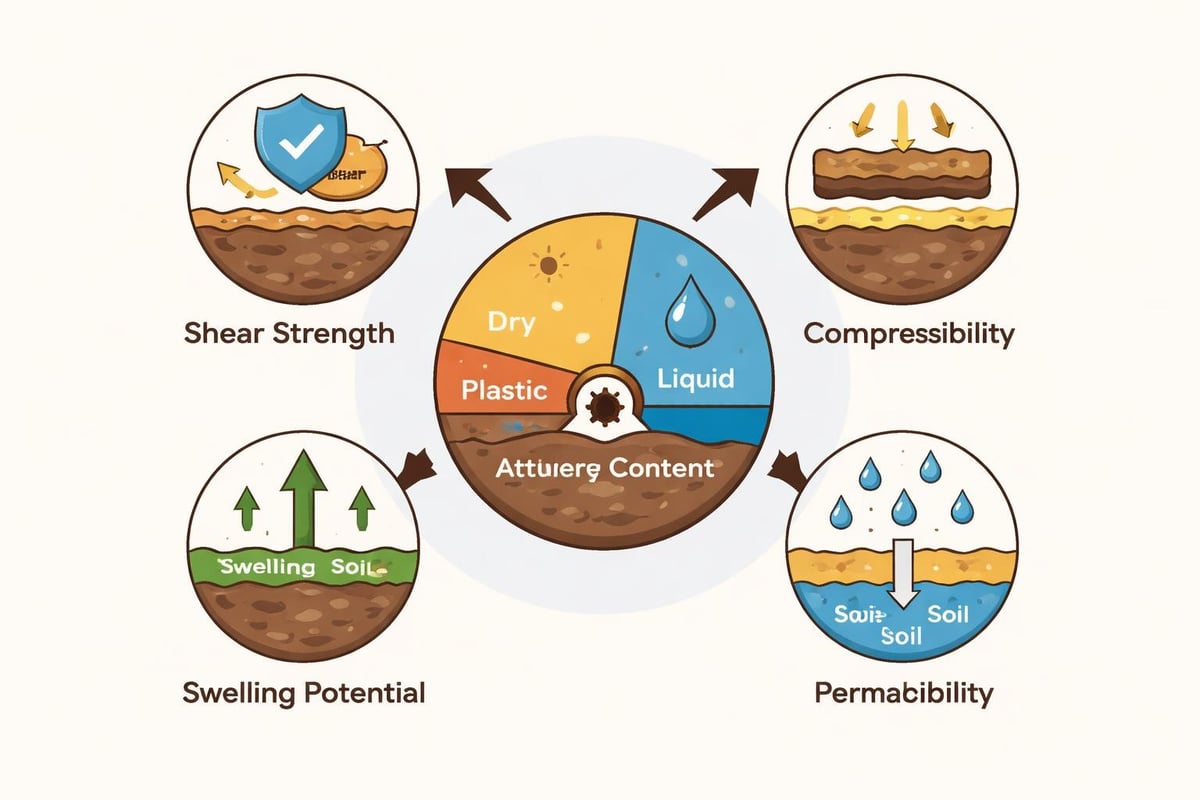
Atterberg limits inform numerous engineering decisions throughout project planning, design, and construction phases. These indices correlate with compressibility, shear strength, permeability, and swelling potential, enabling preliminary assessments before more sophisticated testing occurs. Understanding the importance of these measurements in geotechnical engineering supports effective project delivery across infrastructure sectors.
Foundation Design and Bearing Capacity
Soil plasticity characteristics directly influence bearing capacity calculations and foundation selection. High-plasticity clays typically exhibit greater compressibility and lower undrained shear strength than low-plasticity soils, affecting allowable bearing pressures and settlement predictions. Engineers evaluate plasticity indices alongside other parameters when recommending shallow versus deep foundation systems or specifying foundation depths.
Seasonal moisture variations pose particular challenges in plastic soils, where changes in moisture content produce volume changes that stress foundation elements. Sites characterized by high plasticity index values and low natural moisture content relative to the liquid limit may experience swelling upon wetting, while those with high natural moisture content may shrink during dry periods.
For projects requiring shallow foundation inspection or specialized foundation solutions, Atterberg limits provide baseline data supporting foundation performance evaluation and forensic investigations of distress.
Earthwork and Compaction Specifications
Contractors and construction managers use Atterberg limits to establish moisture conditioning requirements and evaluate fill material suitability. Soils with natural moisture content significantly above the plastic limit require drying before compaction can achieve specified density, while excessively dry materials need moisture addition. The optimum moisture content for compaction typically falls near the plastic limit for many fine-grained soils.
Earthwork considerations based on plasticity:
- Low plasticity (PI < 10): Easy to compact, minimal moisture sensitivity
- Medium plasticity (PI 10-20): Moderate compaction effort, some moisture sensitivity
- High plasticity (PI > 20): Difficult to compact, highly moisture sensitive, potential swelling
Fill specifications often limit maximum plasticity index values to avoid performance issues associated with highly plastic clays. Materials exceeding specified plasticity limits may require blending with granular materials, chemical stabilization, or replacement with more suitable fill.
Slope Stability and Erosion Potential
Slope performance correlates strongly with soil plasticity characteristics. High-plasticity clays exhibit greater susceptibility to slope failures during wet conditions due to reduced shear strength at elevated moisture contents. The liquidity index provides particularly valuable insight into current stability conditions, with values approaching or exceeding 1.0 indicating potentially unstable conditions requiring remediation.
Erosion resistance also varies with plasticity, as soils with moderate plasticity generally demonstrate better resistance to surface erosion than either highly plastic clays or non-plastic silts. Channel design, embankment protection, and drainage system planning incorporate plasticity data to predict long-term performance and specify appropriate erosion control measures.
Correlation with Engineering Properties
Empirical relationships developed through decades of geotechnical practice enable engineers to estimate various engineering properties from Atterberg limits. While site-specific testing remains necessary for final design, these correlations support preliminary analyses and feasibility assessments early in project development.
| Property | Correlation Parameter | Typical Relationship |
|---|---|---|
| Undrained shear strength | Liquidity index | Decreases as LI increases |
| Compression index | Liquid limit | Cc ≈ 0.009(LL – 10) |
| Permeability | Plasticity index | Decreases as PI increases |
| Swelling potential | Plasticity index | Increases as PI increases |
| Shrinkage potential | Shrinkage limit | Increases as SL decreases |
Compressibility and Settlement Prediction
The compression index, quantifying soil compressibility under loading, shows strong correlation with liquid limit values. Highly plastic clays with elevated liquid limits generally exhibit greater compressibility and produce larger consolidation settlements under structural loads. This relationship, while approximate, enables rapid settlement estimates during preliminary design phases.
Consolidation characteristics also relate to plasticity parameters, with the coefficient of consolidation (governing settlement rate) generally decreasing as plasticity increases. Projects involving structures on compressible clay deposits benefit from comprehensive characterization including both Atterberg limits and consolidation testing to predict settlement magnitude and time-dependent behavior.
Strength Parameters and Stability Analysis
Undrained shear strength in saturated clays correlates inversely with liquidity index, providing a rapid assessment method for preliminary stability calculations. Soils with liquidity indices above 1.0 possess minimal shear strength and require stabilization before supporting loads or maintaining stable slopes. This relationship proves particularly valuable during rapid site reconnaissance and emergency response situations.
The plasticity index also influences sensitivity (the ratio of undrained strength in undisturbed versus remolded states), with highly plastic clays often exhibiting greater sensitivity to disturbance. Construction activities that disturb sensitive clays may reduce shear strength significantly, affecting excavation stability and temporary works design.
Limitations and Complementary Testing
While Atterberg limits provide valuable characterization data, engineers recognize several limitations inherent in these empirical indices. The tests measure behavior under specific standardized conditions that may not reflect actual field conditions or loading scenarios. Sample disturbance, preparation methods, and operator technique introduce variability affecting result reliability.
Sample Disturbance Effects
Field sampling inevitably disturbs natural soil structure, potentially affecting measured Atterberg limits. Highly sensitive clays or soils with significant structural anisotropy may exhibit different behavior in their natural state compared to remolded laboratory samples. While Atterberg limits specifically characterize remolded soil behavior, engineers must recognize that in-situ performance may differ substantially from laboratory-based predictions.
Block sampling or other methods minimizing disturbance enable comparison between natural and remolded properties, supporting assessment of structure effects on engineering behavior. Projects involving structured clays benefit from supplementary testing on minimally disturbed samples to evaluate strength loss upon remolding.
Integration with Advanced Testing
Comprehensive geotechnical investigations integrate Atterberg limits with more sophisticated laboratory testing programs. Consolidation tests, triaxial strength testing, and permeability measurements provide quantitative engineering parameters supporting rigorous analysis and design. The combination of index testing and advanced characterization delivers both rapid preliminary assessment and detailed design parameters.
Research examining Atterberg limits in specific geological contexts demonstrates how site-specific conditions influence these measurements and their interpretation. Weathering profiles, mineralogical variations, and depositional environment all affect plasticity characteristics and their correlation with engineering properties.
Modern geotechnical practice employs Atterberg limits as screening tools and classification parameters while relying on project-specific testing for final design. This tiered approach balances cost-effectiveness with technical rigor, allocating resources efficiently across investigation phases.
Quality Control and Result Interpretation
Reliable Atterberg limit determination requires adherence to standardized procedures, proper equipment maintenance, and experienced personnel. Laboratories implementing robust quality assurance programs achieve reproducible results supporting defensible engineering recommendations. Regular equipment calibration, operator training, and proficiency testing ensure data quality throughout testing programs.
Common Sources of Variability
Testing variables affecting results include:
- Sample preparation thoroughness and moisture equilibration time
- Operator technique consistency, particularly for plastic limit testing
- Equipment condition and calibration status
- Environmental conditions during testing (temperature, humidity)
- Clay mineralogy and organic content
Laboratories typically report results from multiple determinations, enabling statistical evaluation of measurement precision. Coefficients of variation exceeding 5-10% warrant investigation of testing procedures or sample heterogeneity. Understanding fundamental aspects of these measurements supports quality control efforts and result interpretation.
Result Validation and Reasonableness Checks
Experienced geotechnical engineers validate Atterberg limit results through comparison with field observations, geological expectations, and historical data from similar deposits. Inconsistencies between laboratory results and field behavior prompt re-testing or additional investigation to resolve discrepancies. Cross-plotting plasticity parameters on standard charts such as the Casagrande plasticity chart identifies potentially erroneous results outside expected ranges for specific soil types.
Correlation checks comparing liquid limit, plastic limit, and natural moisture content reveal physically unreasonable combinations requiring investigation. For instance, natural moisture content substantially exceeding the liquid limit in a stiff clay suggests either sampling issues, laboratory errors, or unusual site conditions warranting additional evaluation.
Practical Considerations for Project Delivery
Engineering consulting firms integrate Atterberg limit testing into comprehensive site investigation programs supporting project planning through commissioning. Testing frequency, sample selection, and result interpretation align with project risk profiles, regulatory requirements, and client objectives. Effective communication of results and their implications enables informed decision-making by project stakeholders.
Investigation Program Design
Geotechnical investigation programs balance data needs against project budgets and schedules. Atterberg limits typically form part of routine classification testing performed on samples from each significant soil unit encountered during boring or test pit programs. Projects involving earth structures, deep excavations, or foundations on fine-grained soils benefit from comprehensive plasticity characterization supporting design and construction planning.
The multidisciplinary approach employed by firms like ZALIG Consulting Ltd integrates geotechnical data with environmental, hydrological, and construction materials considerations. This holistic perspective ensures plasticity characteristics inform not only foundation design but also stormwater management, erosion control, and construction sequencing decisions.
Regulatory and Specification Compliance
Many jurisdictions incorporate Atterberg limit criteria into fill material specifications, earthwork standards, and design requirements. Municipal infrastructure projects often specify maximum plasticity index values for engineered fill or require plasticity testing at prescribed frequencies during construction. Understanding these requirements during planning phases prevents delays and costly material rejections during construction.
Environmental regulations may also reference soil plasticity when establishing containment system requirements, liner specifications, or remediation approaches. Integrating geotechnical and environmental considerations streamlines project delivery while ensuring comprehensive regulatory compliance.
Communication with Non-Technical Stakeholders
Effective translation of laboratory results into actionable recommendations requires clear communication tailored to audience technical sophistication. Project owners, contractors, and regulatory reviewers benefit from summaries explaining plasticity implications in terms of construction risk, cost impacts, and performance expectations rather than abstract index values.
Visual aids including soil classification charts, correlation curves, and comparative tables enhance understanding and support decision-making. Written reports should contextualize Atterberg limits within broader site characterization, explicitly connecting laboratory results to design recommendations and construction considerations.
Understanding and properly characterizing soil plasticity through Atterberg limits remains fundamental to successful geotechnical engineering practice, informing everything from preliminary site assessment through detailed foundation design and construction quality control. These standardized measurements provide essential data supporting defensible engineering decisions while managing project risk and ensuring regulatory compliance. ZALIG Consulting Ltd delivers comprehensive geotechnical investigation and testing services including Atterberg limit determination, integrating laboratory results with field observations and engineering analysis to support civil infrastructure projects across Alberta and beyond. Our multidisciplinary team works collaboratively with clients to translate soil characterization data into practical, constructible solutions that advance your projects from planning through successful commissioning.